Properties of RG-58
This example demonstrates how to use skrf’s to explore some properties of Coax (RG-58). This is done through the media package which provides basic transmission line models. Specifically, the coax is created using by DistributedCircuit.
[1]:
import skrf as rf
from skrf.media import DistributedCircuit
%matplotlib inline
from pylab import *
rf.stylely()
# define a frequency object from a vector
freq = rf.F.from_f(logspace(0,6,1001), unit='hz')
# create a Media object for RG-58, based on distributed ckt values
rg58 = DistributedCircuit(
frequency = freq,
C =93.5e-12,#F/m
L =273e-9, #H/m
R =0,#53e-3, #Ohm/m
G =0, #S/m
)
# loop thru values of resistivity and plot various quantities
for k in (0,.1,1,10,100):
rg58.R = k*1e-3
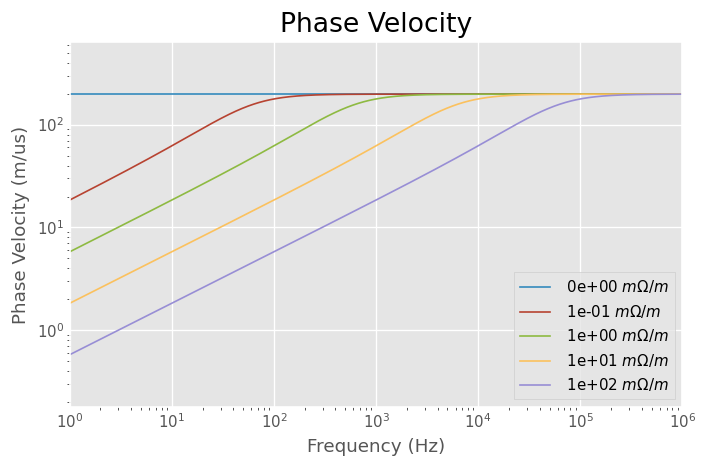
figure(0)
ylabel('Phase Velocity (m/us)')
title('Phase Velocity')
loglog(freq.f_scaled, rg58.v_p*1e-6, label=r' %1.e $m \Omega/m $'%k)
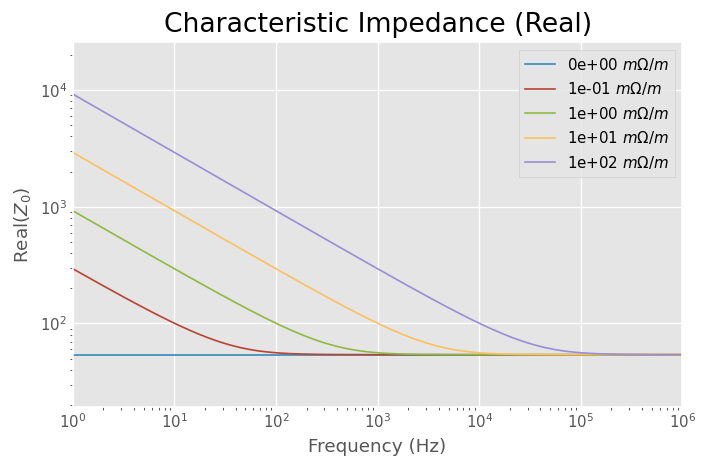
figure(1)
ylabel('Real($Z_0$)')
title('Characteristic Impedance (Real)')
loglog(freq.f_scaled, rg58.z0.real, label=r'%1.e $m \Omega/m $'%k)
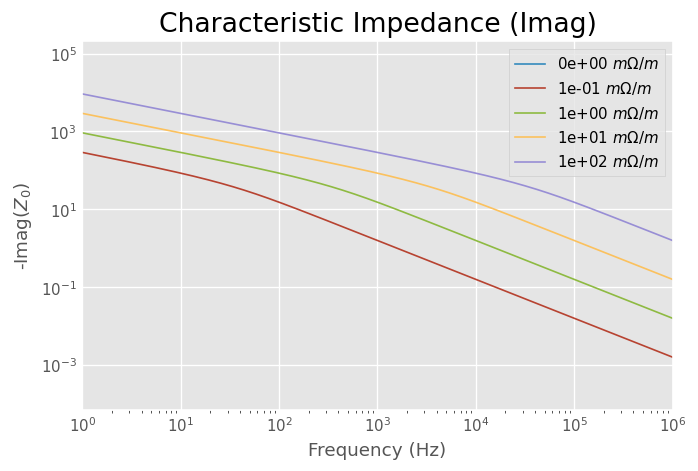
figure(2)
ylabel('-Imag($Z_0$)')
title('Characteristic Impedance (Imag)')
try:
plot(freq.f_scaled, -1*rg58.z0.imag, label=r'%1.e $m \Omega/m $'%k)
except:
pass
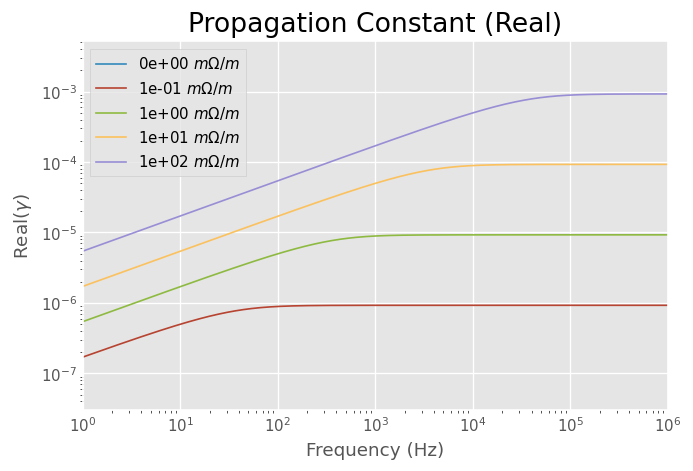
figure(3)
ylabel('Real($\gamma$)')
title('Propagation Constant (Real)')
try:
plot(freq.f_scaled, rg58.alpha, label=r'%1.e $m \Omega/m $'%k)
except:
pass
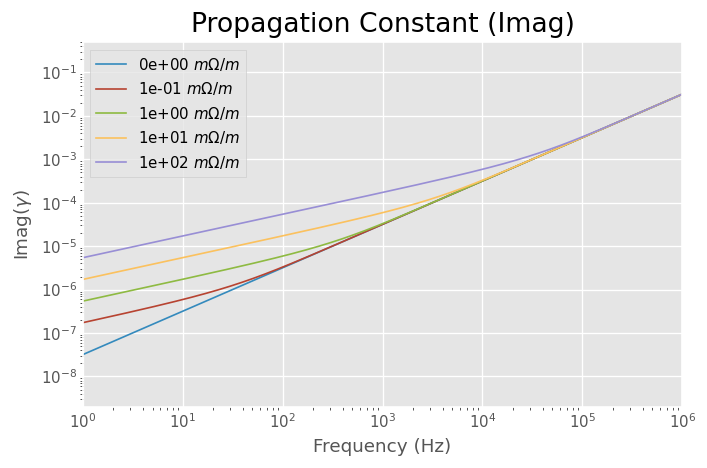
figure(4)
ylabel('Imag($\gamma$)')
title('Propagation Constant (Imag)')
try:
plot(freq.f_scaled, rg58.beta, label=r'%1.e $m \Omega/m $'%k)
except:
pass
from skrf.plotting import func_on_all_figs as foaf
foaf(freq.labelXAxis)
foaf(tight_layout)
foaf(legend)
foaf(loglog)
tight_layout()
/home/docs/checkouts/readthedocs.org/user_builds/scikit-rf/envs/v0.23.0/lib/python3.8/site-packages/matplotlib/cbook/__init__.py:1298: ComplexWarning: Casting complex values to real discards the imaginary part
  return np.asarray(x, float)
[ ]: