Balanced Network De-embedding
Demonstration of balanced, i.e. 2N-port, network de-embedding.
Setup
[1]:
import matplotlib.pyplot as plt

import skrf as rf
from skrf.media import CPW
from skrf.network import concat_ports, connect

rf.stylely()
[2]:
# base parameters
freq = rf.Frequency(1e-3,10,1001,'ghz')
cpw  = CPW(freq, w=0.6e-3, s=0.25e-3, ep_r=10.6, z0_port=50)
Build fixture network
short length of mismatched line with connector-like input shunt capacitance
some crosstalk added with nudge
[3]:
"""
             l1
    0----+-=======-2
         |
         = c1
         |
        GND

             l1
    1----+-=======-3
         |
         = c1
         |
        GND
"""


l1 = cpw.line(20, unit='mm')
c1 = cpw.shunt_capacitor(C=0.15e-12)
l1 = connect(c1, 1, l1, 0)
li = concat_ports([l1, l1], port_order='second')
Fix = li
Fix.name = 'Fix'
Fix.nudge(1e-4)
Left = Fix
# flip fixture for right side
Right = Fix.flipped()
Build DUT network
some length of mismatched lines
some crosstalk added with nudge
[4]:
"""
        l2
    0-=======-2
        l2
    1-=======-3
"""
l2 = cpw.line(50, 'mm')
DUT = concat_ports([l2, l2], port_order='second')
DUT.name = 'DUT'
DUT.nudge(1e-5)
Build the measurement
cascade Left, DUT and Right
add some noise
[5]:
"""
            Left        Meas         Right
             l1          l2           l1
    0----+-=======-2 0-=======-2 0-=======-+----2
         |                                 |
         = c1                              = c1
         |                                 |
        GND                               GND

             l1          l2           l1
    1----+-=======-3 1-=======-3 1-=======-+----3
         |                                 |
         = c1                              = c1
         |                                 |
        GND                               GND
"""
Meas = Left ** DUT ** Right
Meas.name = 'Meas'
Meas.add_noise_polar(1e-5, 2)
Perform de-embedding
[6]:
DUTd = Left.inv ** Meas ** Right.inv
DUTd.name = 'DUTd'
Display results
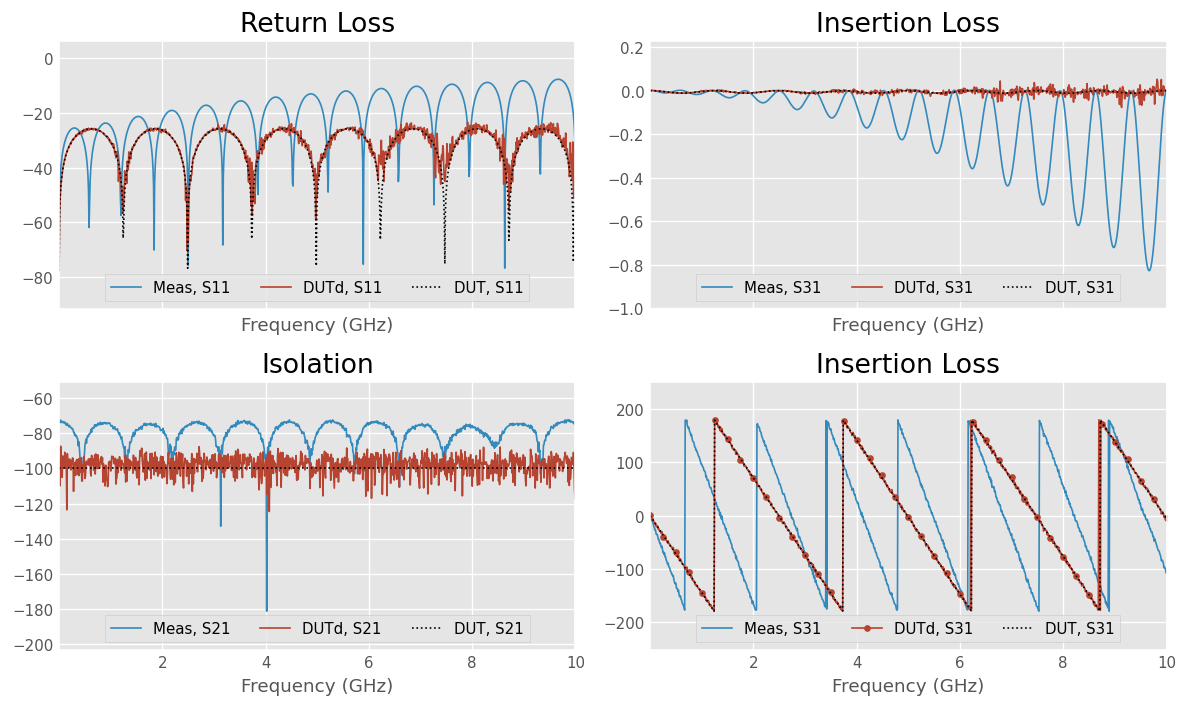
[7]:
fig, axarr = plt.subplots(2,2, sharex=True, figsize=(10,6))

ax = axarr[0,0]
Meas.plot_s_db(m=0, n=0, ax=ax)
DUTd.plot_s_db(m=0, n=0, ax=ax)
DUT.plot_s_db(m=0, n=0, ax=ax, ls=':', color='0.0')
ax.set_title('Return Loss')
ax.legend(loc='lower center', ncol=3)
ax.grid(True)

ax = axarr[0,1]
Meas.plot_s_db(m=2, n=0, ax=ax)
DUTd.plot_s_db(m=2, n=0, ax=ax)
DUT.plot_s_db(m=2, n=0, ax=ax, ls=':', color='0.0')
ax.set_title('Insertion Loss')
ax.legend(loc='lower center', ncol=3)
ax.grid(True)

ax = axarr[1,0]
Meas.plot_s_db(m=1, n=0, ax=ax)
DUTd.plot_s_db(m=1, n=0, ax=ax)
DUT.plot_s_db(m=1, n=0, ax=ax, ls=':', color='0.0')
ax.set_title('Isolation')
ax.legend(loc='lower center', ncol=3)
ax.grid(True)

ax = axarr[1,1]
Meas.plot_s_deg(m=2, n=0, ax=ax)
DUTd.plot_s_deg(m=2, n=0, ax=ax, marker='o', markevery=25)
DUT.plot_s_deg(m=2, n=0, ax=ax, ls=':', color='0.0')
ax.set_title('Insertion Loss')
ax.legend(loc='lower center', ncol=3)
ax.grid(True)

fig.tight_layout()
[ ]: